
Data published today (31 January) by the Department for Environment, Food and Rural Affairs showed that councils in 2021/22 dealt with 1.09 million fly-tipping incidents, a decrease of 4% on the year 2020/21. Fly-tipping on private land is not included in the data.
The statistics are issued with a large measure of caution around accuracy and the drawing of comparisons with previous years.
Enforcement
However, clear changes were seen in the enforcement work by councils which increased. Defra reports that local authorities carried out 507,000 enforcement actions in 2021/22, an increase of 11% on the previous years.
The issuing of penalty notices was up by 58% to 91,000 and is the second most common action after investigations and accounted for 18% of all actions in 2021/22. And, the number of court fines rose to 1,798 being issued, although this remains a tiny fraction of action against the 1.09 million incidents.
Significant points within the data include:
- The percentage of fly-tips involving household waste has fallen from 65% to 61% in 2021/22.
- The most common place for fly-tipping to occur was on highways (pavements and roads), which accounted for over two fifths (43%) of total incidents in 2021/22.
- The most common size category for fly-tipping incidents in 2021/221 was equivalent to a ‘small van load’.
- London remains the area with the highest amount of fly-tipping, followed by north east England.
- The least number of incidents per 1,000 people are in the south west of England.
Household
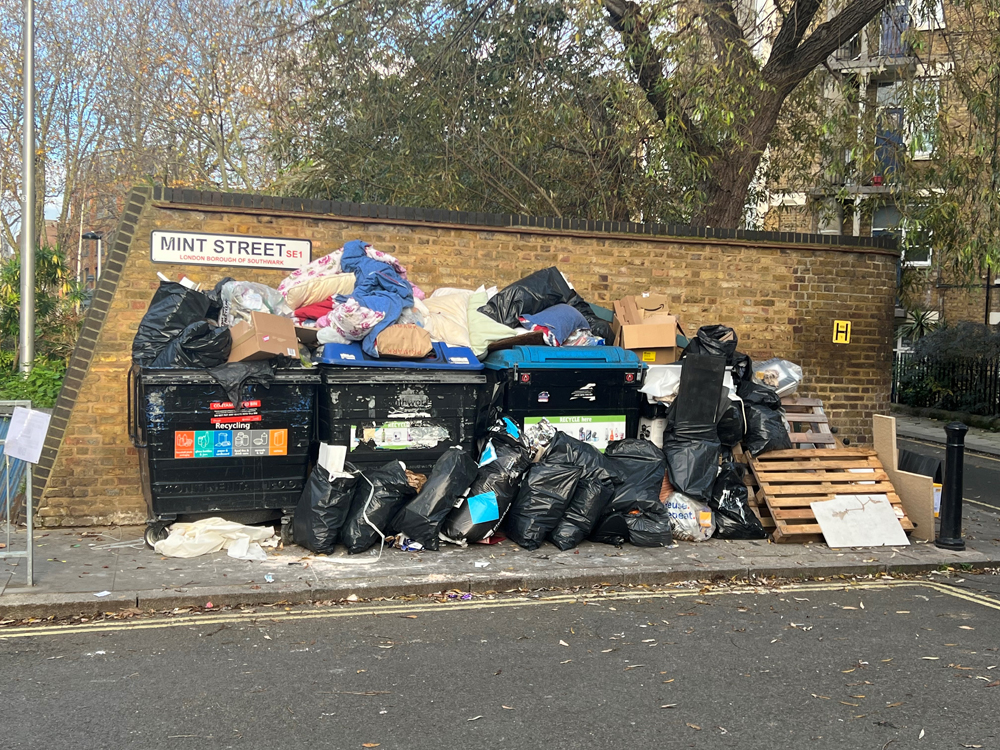
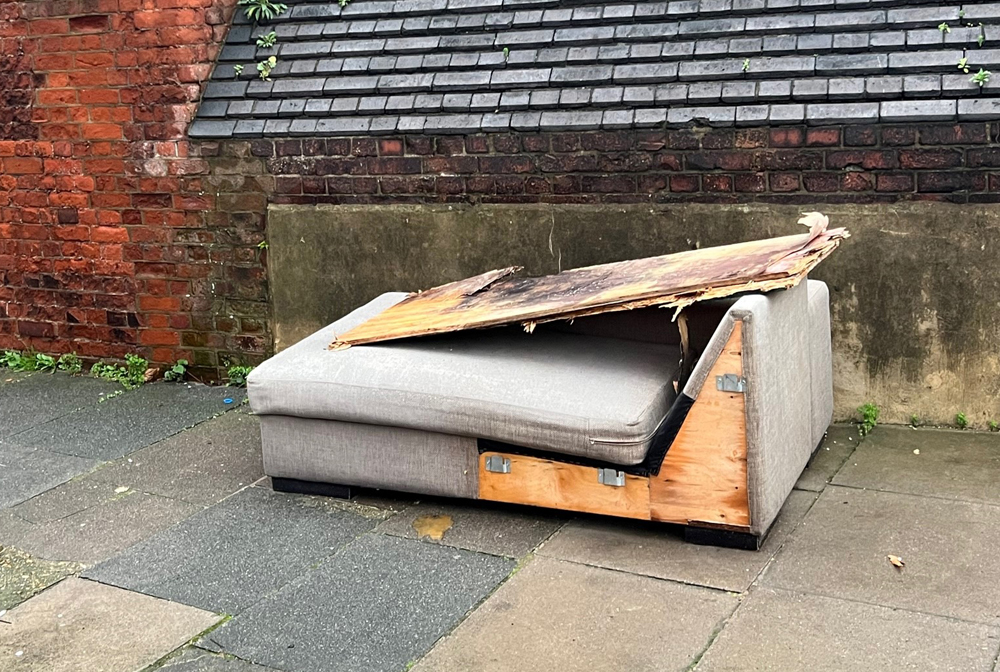
Most fly-tipping incidents, says the Defra report, are household waste the sum of ‘black bags’ and ‘other’), which in 2021/22 accounted for 61% of all incidents. The majority of this was ‘household waste (other)’.
Household waste (other) could include material from house or shed clearances, old furniture, carpets and the waste from small scale DIY works. Other waste was largely commercial waste and could include pallets, cardboard boxes, plastics, foam and any other waste not contained in bags or containers and not due to be collected.
‘Customers’
The report alongside the data is clear to show there are some inconsistencies in reporting by local authorities, particularly around the issue of whether incidents are counted as those reported just by the public (‘customers’) or also by the authority and other bodies.
West London
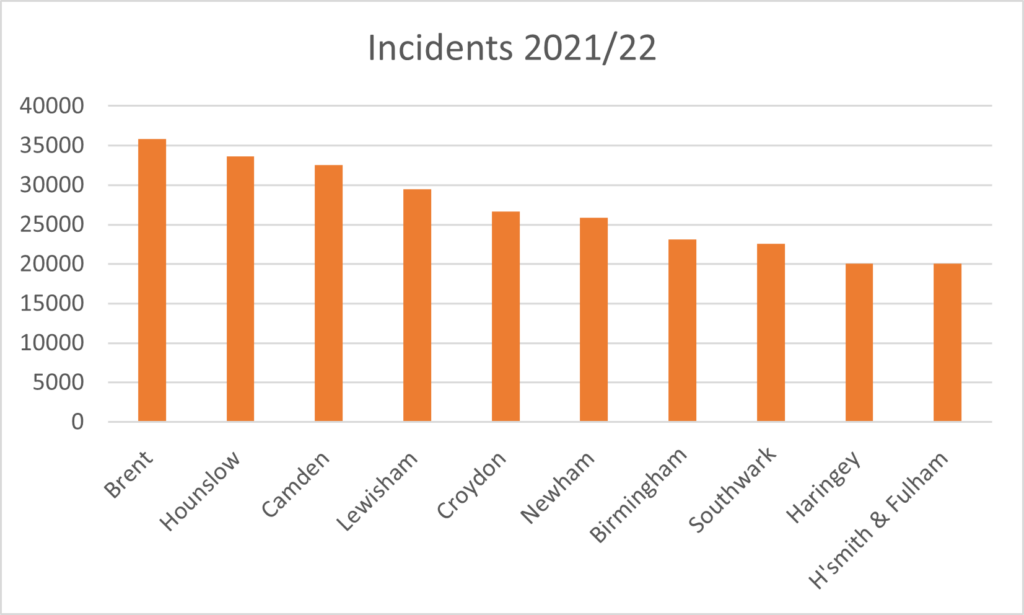
The top two worst authorities for fly-tipping were in the West London Waste Authority area with a huge 35,840 incidents in Brent alone (which has a population of 340,000) and Hounslow, 33,610 incidents (population of 288,000). Brent said earlier this month that with contract changes, “Local people will also benefit from a quicker and more targeted approach to street cleansing, a ‘clear as you go’ approach to illegally dumped rubbish and fly-tipping”. Also of note is that no data was submitted by the London borough of Hackney.
In contrast to the high numbers seen in London, Oadby and Wigston in the East Midlands (population 57,700) reported just 14 incidents and Ryedale in Yorkshire reported 58.
Useful link
The full Defra report is available HERE.


Register for free to comment