


Figures published today (March 31) on the Environment Agencys National Packaging Waste Database show that 7.3 million tonnes of packaging was recycled or sent for energy recovery during the year over 400,000 tonnes more than the 6.8 million tonnes required of them by law.
The performance is likely to put renewed pressure on the government to set more ambitious packaging recycling targets in future. At present, only the material-specific targets for steel and plastics are set to rise in 2011 and 2012, with all other targets remaining flat (see letsrecycle.com story) .
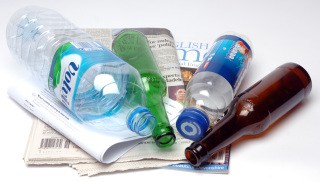
Glass
However, the figures show that the material-specific target for glass (1.69 million tonnes) was only achieved by a small margin with the help of PRNs carried into 2010 from 2009. Under the PRN system, PRNs which are issued in December can either be used against that years obligation or carried over to the following year.
In total, only 1.64 million tonnes of glass packaging was sent for recycling in 2010, rising to 1.71 million tonnes when carry over from 2009 is added.
This is due to a lower-than-expected performance in the fourth quarter. Between October and December 2010, around 330,000 tonnes of glass packaging was sent for recycling or reprocessing over 50,000 tonnes less than during the same period in 2009.
This means that there was considerably less surplus to carry forward to 2011. Carry forward in fact fell to just 12,000 tonnes compared to around 64,000 the year before.
The dip in performance was signalled at the end of the compliance year, when the price of glass PRNs rose dramatically (letsrecycle.com story). At the time, the sudden competition for glass PRNs was attributed to wintry weather in December which prevented many materials from being collected and also to the very low price of the glass PRN, which discouraged reprocessors from issuing them.
The temporary suspension of glass reprocessor Nationwides PRN accreditation in December may also have had some impact (see letsrecycle.com story).
Low
Ian Andrews, senior market operator for the Environment Exchange (t2e)PRN trading platform, told letsrecycle.com that he was somewhat surprised by quite how low the glass figure for Q4 was.
However, he said that he expected much of the tonnage which was missing from the figures to be made up in the first quarter of 2011, as the weather improved and the prices of PRNs recovered. This, he said, meant that prices for glass PRNs should not shoot too far upwards.
He said: I should expect we will get a short period of sellers trying to talk up glass prices on the back of these figures but I dont think prices will run away with themselves. Only when data is published for the first quarter of 2011 will we really know if there is going to be an issue with glass this year.
Gareth Goodall, of trading platform scrap-ex, added that he expected the figures to firm glass PRN prices up around the 10 level.
He said: Im not sure what if any impact Nationwide will have on the glass numbers as they are yet to report.
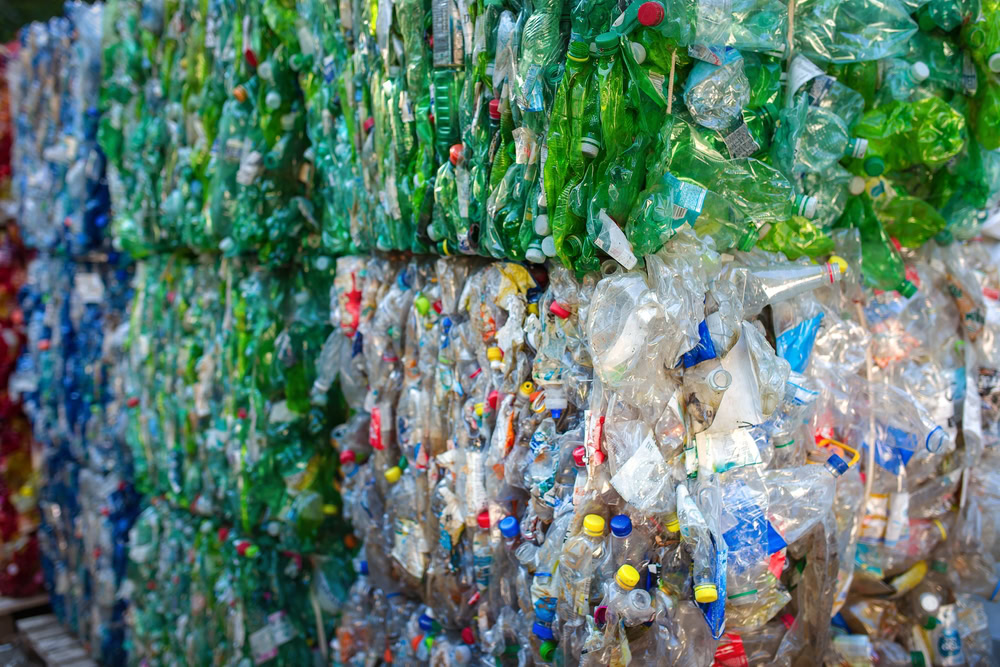
Plastics
“Plastics could be more finely balanced than expected”
Ian Andrews, t2e
The figures also show a slight dip in plastics packaging recycling performance in the fourth quarter of 2010. During the period around 138,000 tonnes of plastics packaging was sent for reprocessing which is below the average of 153,000 tonnes seen in the other three quarters.
And, while the yearly target to recycle 545,000 tonnes was met with ease with a total of 598,000 tonnes recycled only 27,000 plastics PRNs were carried over to 2011.
This has raised concerns in some quarters that the plastics PRN market might be tight in 2011 especially because the business targets rise considerably this year from 29% to 32%.
Edward Cooke, of compliance scheme Compliance Link, said: Plastics will be tight in 2011 as we only did 598,000 tonnes last year. We will need to improve to ensure we meet the higher target.
The Environment Exchanges Mr Andrews said: Plastics could be more finely balanced than expected.
Future
Despite these glitches in performance, Mr Cooke said that the government needed to live up to its promise to be the ‘greenest government ever’ by considering setting higher packaging recycling targets in future as most of the targets had been very comfortably met.
He said: “The figures show that the targets need to be increased – they are widely wrong in the case of paper, where half a million PRNs were thrown away – ie given back to the Agency for nothing at the end of the year.”
However, Phil Conran, of consultancy 360 Environmental,warned that packaging recycling targets could become more difficult to achieve as councils were forced to slash their budgets.
He said: “The only question now is whether with the local authority cuts and recycling centres being closed we will see less material collected by councils.”
Packaging recycling and recovery in 2010 (t)
| Carried into 2010 | Q1 2010(t) | Q2 2010 | Q3 2010 | Q4 2010 | Total (exc. carry over) |
|
|---|---|---|---|---|---|---|
| Paper | 211,704 | 763,554 | 743,200 | 813,440 | 783,192 | 3,103,386 |
| Glass | 63,657 | 388,497 | 457,192 | 473,515 | 328,712 | 1,647,916 |
| Aluminium | 3,462 | 13,927 | 13,826 | 16,192 | 16,358 | 60,303 |
| Steel | 24,027 | 116,672 | 92,674 | 97,736 | 80,539 | 386,621 |
| Plastic | 35,229 | 159,970 | 145,590 | 154,194 | 138,498 | 598,252 |
| Wood | 41,174 | 197,464 | 202,047 | 199,386 | 172,993 | 771,890 |
| Total recycling | 379,253 | 1,640,084 | 1,654,529 | 1,753,463 | 1,520,292 | 6,568,368 |
| EfW | 37,908 | 158,106 | 187,008 | 183,627 | 192,764 | 721,505 |
| Total recovery | 417,161 | 1,798,190 | 1,841,537 | 1,937,090 | 1,713,056 | 7,289,873 |
| Total (including carry over) | 2010 targets (t) | 2010 targets (%) | Carry forward into 2011 | ||
|---|---|---|---|---|---|
| Paper | 3,315,090 | 2,535,057 | 69.5 | 183,316 | |
| Glass | 1,711,573 | 1,696,867 | 81 | 12,215 | |
| Aluminium | 63,765 | 59,175 | 40 | 3,615 | |
| Steel | 410,648 | 340,130 | 69 | 17,747 | |
| Plastic | 633,481 | 544,887 | 29 | 26,642 | |
| Wood | 813,064 | 204,749 | 22 | 24,552 | |
| Total recycling | 6,947,621 | 6,357,078 | 92% of recovery | 268,087 | |
| EfW | 759,413 | n/a | n/a | 33,040 | |
| Total recycling/recovery | 7,707,034 | 6,827,440 | 74 | 301,127 |
Source: National Packaging Waste Database

Subscribe for free