


The government released the full results of its 2002/03 Municipal Waste Management Survey for England today, confirming that English councils recycled 14.5% of household waste in that year.
The results officially confirm provisional results from the survey, which were released in December 2003 (see letsrecycle.com story).
The national recycling rate of 14.5% represents a 2% increase on the previous year – compared to a 1% growth in previous years. Defra said this would mean England would meet its 17% recycling rate target for 2003/04, “the first time such a target will ever have been met”.
Commenting on the results, environment minister Elliot Morley said: “Most councils are working hard to improve recycling rates, providing kerbside boxes and expanding the range of waste materials collected, for example.”
But the minister added his concerns about those councils not yet achieving a 10% recycling rate. He said: “A significant minority are still not doing enough – in some places the national minimum target of 10% has not been reached.
“Defra can help local authorities improve, and wants to work together with less-strong performers to achieve better results. But those who do not show a commitment to improve their recycling levels risk intervention by the government to make it happen,” he warned.
A total of 3.7 million tonnes of household waste was collected for recycling in 2002/03 according to the survey, compared to 3.2 million tonnes (12.5%) in 2001/02.
Materials
Defra said that for the first time compostable waste was the material most collected for recycling in 2002/03, with 1.2 million tonnes or 32 per cent of the total recycled. Previously the most common material had been paper/card, and collections of this still increased in 2002/03 to 1.1 million tonnes (30%).
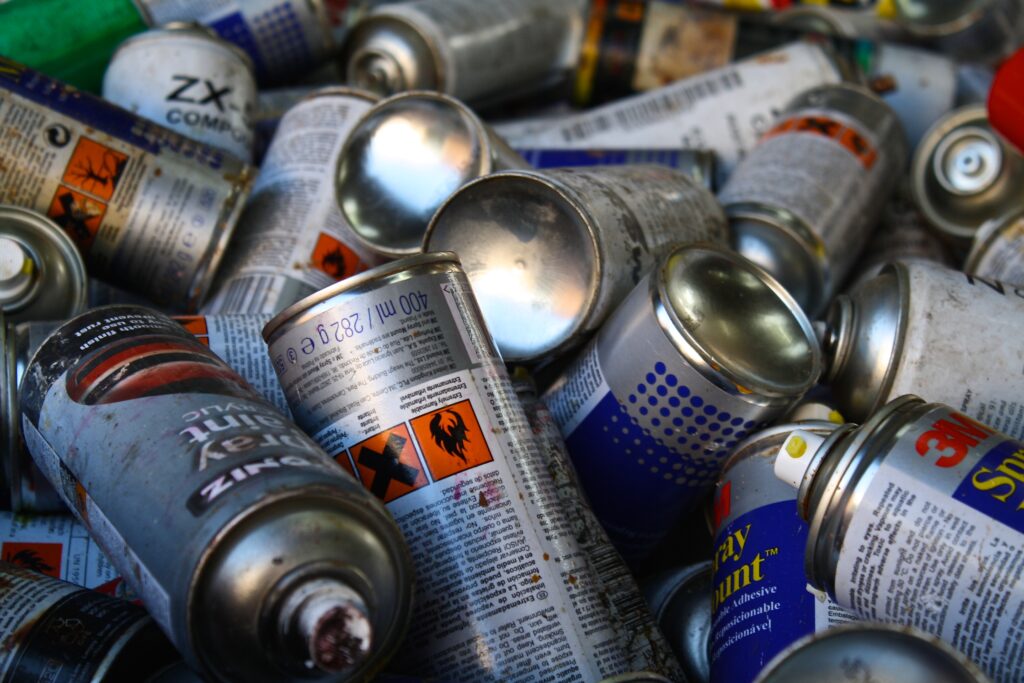
Other materials collected by councils included 500,000 tonnes of glass (13% of material recycled), scrap metal and white goods (400,000 tonnes). Similar amounts of cans – aluminium and steel – were collected in 2002/03 as in the year before, with 27,000 tonnes collected.
The survey revealed a 21% increase in the amount of co-mingled materials collected for recycling, up to 270,000 tonnes in 2002/03. Most common materials in co-mingled collections were paper/card, cans, plastic and textiles.
Of the 3.7 million tonnes of material collected for recycling, two thirds (2.5 million tonnes) was collected from civic amenity sites or bring banks, with about 34% collected from kerbside schemes. This shows a growth in the proportion of materials collected from the kerbside since the year before, when 69% of materials were collected from CA sites or bring banks.
About 2.5 million tonnes of material were collected through these sites in 2002/03, which is a 12 per cent increase over the 2.2 million tonnes collected in 2001/02.
CA sites
Though the proportion of waste collected through CA sites (and bring banks) fell to 66% of the total waste recycled, the amount of waste recycled at CA sites increased by 12% from 2.2 million tonnes in 2001/02 to 2.5 million tonnes in 2002/03.
Most of the waste collected at CA sites was compostable waste – 40% – with the other main materials paper/card (18%), scrap metal and white goods (16%) and glass (15%). The amount of compostable waste collected at CA sites increased by 21%, with paper/card increasing by 5%, glass collection increasing by 5% and scrap metal/white goods increasing by 12%.
Civic amenity and bring sites were responsible for the collection of 84% of the green waste that was collected in 2002/03. Defra said this proportion has been falling slightly with the increased importance of kerbside green waste collections.
Kerbside
About 67% of all households were now served by some kind of kerbside recycling scheme in 2002/03. This is an increase on the 58% figure for the year before. The amount of waste collected for recycling through such schemes also increased, by 29% to 1.2 million tonnes in 2002/03.
In 2002/03, just over one in three councils (35%) collected four or more different materials in a kerbside recycling scheme. About 32% of households had between one and three materials collected. Under the Household Waste Recycling Act 2003, councils must provide collections for at least two materials for 90% of their households by 2010.
Most kerbside schemes in 2002/03 were carried out on a fortnightly basis – 44% of households had a fortnightly collection of recyclables in that year, compared to 20% that had a weekly collection.
Though green waste may have overtaken paper/card through collections at CA sites, paper/card is still by far the most common material collected at the kerbside. Just over half – 660,000 tonnes – of the material collected in English kerbside recycling collections was paper/card.
Green waste made up 16% of kerbside collections, while glass made up 7% of kerbside schemes. About 20% of kerbside schemes were of co-mingled materials.
The amount of paper/card collected from the kerbside has increased by 22% since 2001/02, with the amount of green waste and glass collected both increasing by over 40% in the 12 month period.
For the full Municipal Waste Management Survey 2002/03, see the Defra website.


Subscribe for free