

However, in more positive news, the total weight of ‘waste from households’ in England decreased to 21.3 million tonnes in the same period, down 6.6% from the 22.8 million tonnes in 2021/22.
The statistics can be seen here.
This is using the ‘waste from households’ metric for the 2022/23 financial year, which includes IBA metals. It excludes local authority collected waste not considered to have come directly from households, such as street bins.
Defra now makes more use of annual year figures rather than financial year figures, but historically the financial years have been used to reflect trends in the UK.
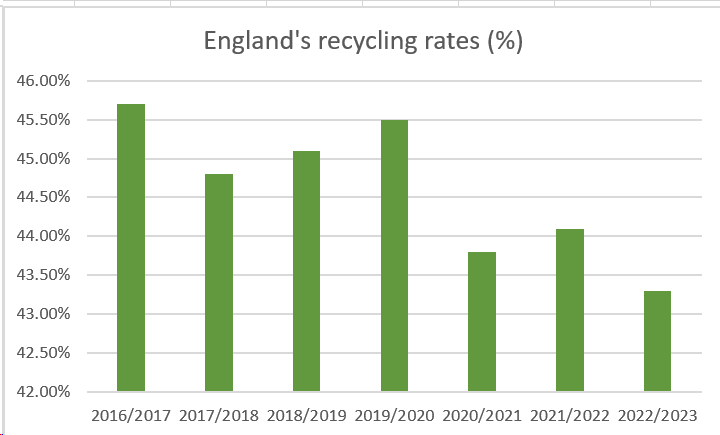
The 2022 calendar year rate was 43.4% in 2022, a decrease of 0.7 percentage points from 2021 when the rate was 44.1%.
Recycling
Dry recycling was 5.5 million tonnes in 2022/23, decreasing by 5.9% from 5.8 million in 2021/22. Organic recycling decreased by 12% to 3.7 million tonnes.
The tonnage of residual waste in 2022/23 was 5.3% lower than in 2021/22, down 0.7 million to 12.1 million tonnes.
Local authority waste
Local authority collected waste consists of all ‘waste from households’, street sweepings, municipal parks and gardens waste, beach cleansing waste, and waste resulting from the clearance of fly-tipped materials plus some commercial and/or industrial waste.
Total local authority managed waste in 2022/23 was 24.5 million tonnes, down by 1.6 million tonnes (6.0%) from 2021/22.
The amount of local authority collected waste sent for recycling in 2022/23 was 10 million tonnes, down 0.8 million tonnes from 2021/22. Waste sent for recycling comprised 40.7% of all local authority waste, a decrease of 0.8 percentage points from 2021/22.
In terms of incineration, 49.1% of all local authority waste was sent for this method 2022/23. This was a total of 12.1 million tonnes, and a decrease of 0.3 million tonnes.
A further 7.2% was sent to landfill.

Register for free to comment