


However, the data covering the 2017 calendar year, shows that the UK is now sending proportionally less waste to landfill than many of its European counterparts.
The figures are compiled annually based upon municipal waste data submitted to the EU by members states, as well as some non-member nations.
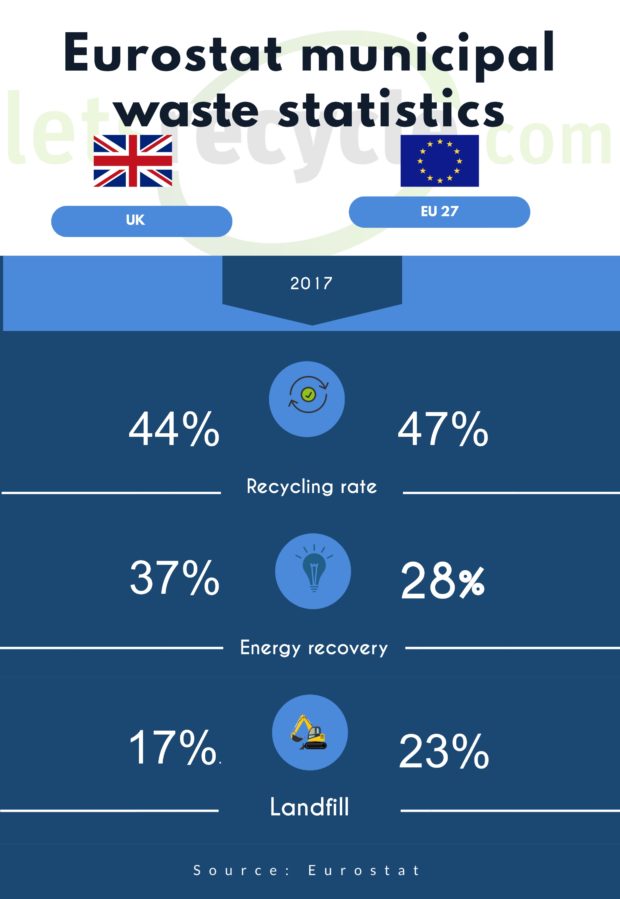
As outlined in the table to the right, data on the amount of waste recycled and composted in the 2017 calendar year shows that the UK’s recycling and composting rate remained static on 44%, 3% lower than the average rate recorded by EU member states.
The Eurostat data also shows that Germany – which generated the most waste across the continent at 52 million tonnes – achieved a recycling and composting rate of 67.6% in 2017. Other top performers included Austria and Slovenia (both on 57%), the Netherlands (54%) and Belgium (53%). Overall, the UK ranked 11th in terms of its recycling rate.
Countries including Norway (39%), Spain (33%) and France (43%) all recorded lower recycling rates than the UK.
Waste generated
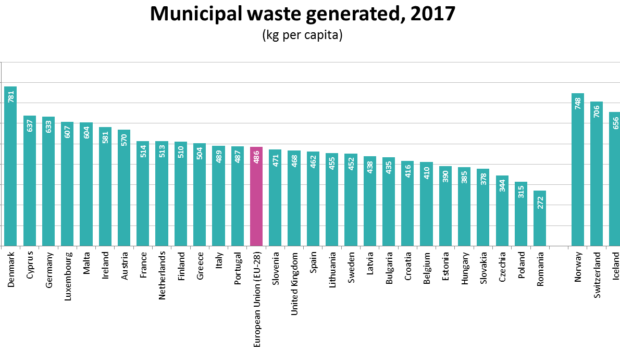
On waste generated, the UK produced the third most waste by tonnage, at 31 million, but ranked 15th in terms of waste produced per citizen, at 468kg per capita. Denmark topped the municipal waste generated per capita table, at 781 kg, while Romania was bottom at 272kg.
Energy from waste
When looking at energy from waste, the Netherlands sent around 44% of its waste to energy recovery facilities, while Norway and Denmark sent 53%. The UK’s energy recovery rate stood at 37%, above the EU-wide average of 28%.
Spain was among the worst performing EU member states when looking at landfill rates, sending 53% of its waste to landfill. France and Italy also both landfill more municipal waste than the UK proportionally.

Eurostat noted that the long term trend has been towards a reduction of waste to landfill – which has been driven by the EU’s Landfill Directive which sets targets for reducing the amount of waste that is disposed of in landfill. This has prompted an increase in the amount of waste recycled, composted and sent to energy from waste facilities.
“The total municipal waste landfilled in the EU-28 fell by 88 million tonnes, or 60% – from 145 million tonnes (302 kg per capita) in 1995 to 58 million tonnes (113 kg per capita) in 2017. This corresponds to an average annual decline of 4.1%. For the shorter period 2005-2017 landfilling has fallen by as much as 5.6% per year on average,” the statistical body said.
As a result, the landfilling rate compared with municipal waste generation in the EU-28 dropped from 64 % in 1995 to 23 % in 2017, the data suggests.
Related Links
Eurostat Municipal Waste Statistics


Register for free to comment