


(Editor’s note: this is not new data but has been presented in a useful format by the minister).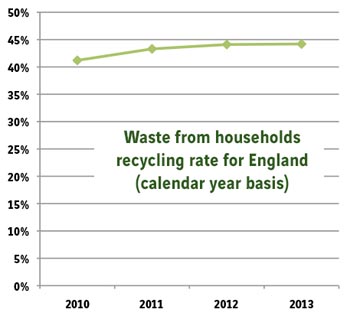
The data comes after Mr Rogerson, earlier this month, said that there would be no special measures taken to push up England’s recycling rate but rather the focus would be on learning from the better performing local authorities and then taking some of their successes into councils who were not performing so well.
‘Most relevant’
Responding to Mr Simpson last week, the minister said: “The most relevant recycling data which is regularly measured relates to waste collected and managed by local authorities. This is reported on a quarterly basis and data for England is published each quarter by Defra in statistical releases with accompanying datasets.”
He continued: “The latest data for 2013-2014 for England was published in November last year and is available on the gov.uk website. UK data on the waste from households recycling rate is also available but only up to 2012. This data is also available on the gov.uk website.”
The data shows, in the chart above and the table below, that the recycling
| 2010 | 2011 | 2012 | 2013 | |
| England | 41.2% | 43.3% | 44.1% | 44.2% |
| UK | 40.3% | 42.9% | 43.9% | Not available |
rate for England has only risen by 3% over the calendar years from 2010 to 2013.
Local authority collected waste

In terms of the recycling rate for all local authority collected waste for England, for the financial years 2009/10 to 2013/14, this is shown in the table below and illustrated in the chart to the right.
| 2009/10 | 2010/11 | 2011/12 | 2012/13 | 2013/14 |
| 38.7% | 40.4% | 42.1% | 42.4% | 42.8% |
This dataset shows that over a five-year period, the recycling of local authority collected waste for England has risen by 4.1%.


Register for free to comment