


Pricespaid forplasticspackaging waste recovery notes (PRNs)have shot up following the publication of datasuggestinga ‘poor’ packaging recycling performance in the first quarter of 2012.
The provisional calendar year data, published by the Environment Agency,showsthat the amount of packaging recovered or recycled in January – March 2012 fell by almost 130,000 tonnes to 1.72 million tonnes whencompared to the1.85 million tonnes produced in the comparable period in 2011. And, the January – March 2012 figure is also 100,000 tonnes less than that recordedfor the final quarter of 2011 (see table below).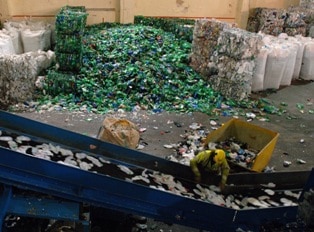
Aparticularfall was seen in the first quarter of 2012 inthe case of plastics and glass, where reprocessing and exporting fell by18% and 15% respectively when compared to the final quarter of 2011. The figures are published on the Agency’s National Packaging Waste Database.
Worrying
While some major reprocessors are still to report their data, meaning that the figures could change, commentators were quick to describethe performanceas ‘worrying’ – particularlyin the case ofplastics. This is because the targets for recycling plastic packagingare set to rise by 5% a year from2013 (see letsrecycle.com story).
As a result, the price being paid for plastics PRN prices on the spot market hasrisen from around 9-10 a tonne toas much as15 a tonne.
However, one factor affecting the figures could be thata number of large reprocessors and exporters are still to report their data. According to the Agency these include: British Polythene; Glass Recycling (UK) Ltd; CK Polymers Ltd, Monoworld Ltd and International Recycling Ltd.
The Environment Exchange (t2e)PRN trading platform said it hadseen a’flurry’ of trading already, especically in plastic where upon opening of the market, tonnage at 10 sold out immediately, followed by an immediateprice rise to 13 a tonne.
Thomas Rickerby, senior market operator in the plastic market at t2e, said: “Anyone with any concerns over how the plastics market was going to meet the challenging 5% target increase in 2013 will be dismayed by the 2012 Q1 figure. It was always going to be a potentially volatile year for plastic after confirmation of next year’s target increase, and the current deficit position shown in these preliminary figures could compound this, leading to an acute price rise.”
Concerns
Phil Conran, of consultancy 360 Environmental,agreed that the figures raised ‘concerns’ over theability of producers to meet their packaging recycling targets for plastics both this year and next.He suggested the shortfallin plasticscould belinked to atemporaryshortage of containers for export as well as a tightening in quality requirements in China. He suggested that some reprocessors may also not have registered to issue PRNs as their value has been so low.
“Thereare still quite a number of large accredited reprocessors which have not declared their tonnages.We think the figures will get revised upwards”
Duncan Simpson, Valpak
He said: “The quarter one figures are very poor. It is difficult to know if that is caused by factors which will be compensated for later in the year and therefore we will be able to catch up of whether there are some underlying factors which will make it difficult to catch up – for instance we have not got sufficient reprocessors registered to issue PRNs or there has been a downturn in the amount of material collected.”
Valpak
However, Duncan Simpson, director of sales and marketing at compliance scheme Valpak, said it was too early to read too much into the numbers and that he expected the situation to level out as the year progresses.
Mr Simpsonsaid: “Thereare still quite a number of large accredited reprocessors which have not declared their tonnages.We think the figures will get revised upwards.
“Over the last few years quarter one has often been quite slow. I think everything will start to normalise in the second quarter. Over the last few years quarter one tonnage has been slowso it is too early tocome to any conclusions.”
Q1 2012 Reprocessing and Exporting Figures
| Material |
Recovery and recycling in Q1 2012 (t) |
PRNs needed per quarter (2011 requirement) |
Difference | Recovery and recycling in Q4 2011 (t) | Difference compared to Q1 2012 (%) |
|---|---|---|---|---|---|
| Paper | 797,173 | 648,663 | 148,510 | 826,448 | -3.5% |
| Glass | 379,153 | 424,839 | -45,687 | 446,366 | -15% |
| Aluminium | 15,963 | 15,138 | 825 | 17,053 | -6.3% |
| Steel | 91,130 | 87,655 | 3,475 | 80,311 | +13.4% |
| Plastics | 117,162 | 152,041 | -34,880 | 142,770 | -17.9% |
| Wood | 128,288 | 57,710 | 70,578 | 129,956 | -1.2% |
| Total recycling | 1,528,937 | 1,629,963 | -101,026 | 1,642,904 | -6.9% |
| Recovery | 194,750 | n/a | n/a | 178,312 | +9.2% |
| Total recycling and recovery |
1,723,687 | 1,750,839 | -27,152 | 1,821,216 | -5.3% |
Source: letsrecycle.com analysis of figures on the National Packaging Waste Database



Register for free to comment