
![]()
Interpreting the new data releases requires caution, lest the markets spiral into sentiment-led chaos.
The PRN markets, like all others, are guided by their fundamentals. Supply and demand work in concert to establish price. Timely and accurate data allows market participants to react dynamically, ensuring that prices are aligned with the fundamentals.
Incremental recycling targets work to keep demand at competitive levels, creating incentives to recycle more packaging, while PRN revenues are invested in improving infrastructure and capacity, so that ever-increasing targets can be achieved.
Yet if we do not understand the fundamentals, we operate based on sentiment alone and the market ceases to function effectively. It can appear to lack transparency, and prices can change unexpectedly.
What follows is an attempt to outline the fundamentals, at least as I understand them, with reference to two recently published datasets: the 2026 UK producer obligation (demand) and the 2026-Q1 packaging handled (supply).
Demand is a moving feast
The demand side of the market is relatively easy to measure. Producers submit placed on market (PoM) data to the regulators, often via compliance schemes, which is used to calculate their obligation. The UK obligation – total demand for PRNs – is the sum of this.
The latest report was published on 15 May 2026 and is shown below compared to 2025.
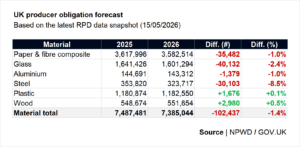
With the exception of plastic and wood, obligations look to be lower this year. However, we need to be cognisant of missing data.
Obligation is calculated from the previous year’s placed on market data. The below chart compares the amount of packaging submitted to the Report Packaging Data (RPD) service for 2024 and 2025.
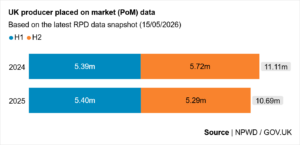
While H1 looks broadly similar across both years, the 2025-H2 data looks understated by around 400,000 tonnes. This is likely due to submissions yet to come in. Indeed, UK obligation rose by more than 200,000 tonnes over the course of last year due to late submissions and resubmissions.
While PackUK have advised an earlier resubmission cut-off date this year, we would still expect more submissions to be made throughout the year – with obligations ultimately ending up higher than last year.
The key exceptions here are glass and steel, where there does seem to be a genuine shift away from these materials in favour of lighter – though not necessarily more circular – materials.
The much-anticipated Q1 data
We finally got our first look at in-year supply on 06 May 2026. Responding to requests for greater clarity, the Environment Agency (EA) re-released it on 14 May 2026 with explanatory notes and additional context.
The report leads with an important disclaimer:
“Figures are provisional and based on submissions received to date; a notable proportion of data is still expected and will be included in future updates.”
Helpfully, the extent of the missing data is detailed in the second tab. This is shown below and compared to the number of accredited organisations for each material (as per the register from 15 May 2026):
- Paper: 5 outstanding (12% of accredited organisations)
- Glass remelt: 6 outstanding (18% of accredited organisations)
- Glass aggregate: 4 outstanding (18% of accredited organisations)
- Aluminium: 4 outstanding (12% of accredited organisations)
- Steel: 6 outstanding (26% of accredited organisations)
- Plastic: 31 outstanding (19% of accredited organisations)
- Wood: 4 outstanding (24% of accredited organisations)
Overall, almost 1 in 5 accredited organisations have outstanding data returns. We therefore need to be cautious and not read the data at face value.
Caveats upon caveats
Beyond missing data, the crucial caveat – which was published in a Defra newsletter on 15 May 2026 but is curiously absent from the guidance on GOV.UK – relates to ‘waste balances’. Essentially, the data cannot be directly compared to previous reports from the National Packaging Waste Database (NPWD):
“The figures published in Aggregated packaging waste data: January to March 2026 do not include the aggregated ‘waste balance’ for all accredited waste operators; that is, the tonnage of PRNs/PERNs that could be issued but have not yet been.”
This means that ‘tonnage received for recycling or exporting’ in the new reports does not equate to the ‘total waste accepted or exported’ from the old reports.
An additional nuance is that there are now two types of operators: those who issue PRNs based on the weight of packaging waste received and those who issue PRNs based on the weight of recycling outputs. These are combined into a single column, meaning that “the total ‘packaging waste received for recycling’ figure will be higher than the tonnage on which PRNs/PERNs can actually be issued”.
The situation is further confused by the impact of the new export rules: tonnage that has been exported is not included in waste balances until it has been received by the overseas reprocessor and all documentation has been completed.
Taking all of this together, the most important metric is missing: there is no ‘tonnage on which evidence may be issued’ equivalent in the new reports, so the true extent of PRN supply is unknown.
So, what do we actually know?
This cautious reading of the Q1 data can be summarised as follows:
- There is a lot of missing data.
- The report cannot be directly compared to previous quarterly reports.
- Exported volumes are especially understated due to the transit and administrative time lag.
- The true extent of PRN supply is not yet known.
Given this, there isn’t much we can categorically say about the state of PRN supply so far this year.
If we acknowledge that it is not a like-for-like comparison, we can get an indicative sense of supply by comparing the 2026-Q1 tonnage received (for reprocessing or exporting) against the total waste accepted or exported from previous quarters.
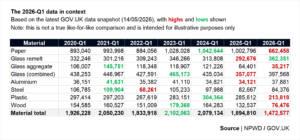
Whichever way you look at it, this is not a typical Q1 dataset. It is clear that there are a lot more data submissions to come in – especially in paper, plastic and wood – yet the glass remelt figure looks very strong. Even if we use the ‘tonnage recycled or exported’ figure, it is still very high (349 kt recycled vs. 362 kt received). Aluminium and steel are perhaps the only ‘normal’ looking materials, which is interesting in its own right given that these are export-heavy markets.
Until we have something more concrete it would be remiss to read too much into the data.
We are far from being out of the woods
While it is good to have some data, we must be careful in how we use it.
It is testament to the resilience of the PRN system that, even in the midst of this widespread uncertainty, the markets have remained broadly calm. Prices have fluctuated of course, but there does not seem to be much panic.
Ultimately, it will probably all come out in the wash. More data will come in, waste balances will be added and export volumes will begin to look more believable. All being well, we should have a much clearer picture of the market fundamentals in the coming weeks and months.
Until we can be confident on the veracity of the reports, I would caution against a strong reaction.


Matthew – very interesting article that summarises the market very well – latest data still shows 2 x large (10 KMT+) exporters still not submitted any returns for Q1/2026, with 9 non-reports for April (10KMT+ exporters)