



And, the body – which includes organisations and experts such as Valpak, INCPEN, Alupro, Corus, British Glass, RECOUP and WRAP – claims that increasing capture rates from existing collections rather than extending kerbside coverage will be key to achieving this.
Projected packaging recycling rates by 2012
Aluminium 42-44%
Glass 82-83%
Paper & board 80-88%
Plastic 25-28%
Steel 74-77%
Wood 92%
Total recycling 68-72%
Source:PackFlow 2012
The research study, entitled ‘PackFlow 2012', was prepared by Valpak Consulting and builds on research published by the PackFlow group since 2005. Defra, BIS and the devolved administrations have followed the project closely, using it to inform the implementation of the Packaging Strategy.
Using reports and published statistics alongside complex predicative modelling techniques, the study maps the flow of packaging by material into UK waste streams and predicts future recycling trends. It also projects the gap between what is presently collected and what we need to recycle in the future.
Writing in the foreword to the report, environment minister Dan Norris said: “In our recent Packaging Strategy, we set out our aim of being amongst the best in Europe over the next 10 years by moving towards a 70% recycling target.
“This highly detailed PackFlow study by Valpak and its partners show some of the practical implications of this challenge. It is an important contribution, and will be extremely useful as we start work on our detailed plans.”
Steve Gough, Valpak chief executive, said: “The PackFlow project is an impressive piece of work, with each member of the stakeholder group bringing its own knowledge and support to the project.
“I am sure you can see that the findings of the report are significant and provide direction to many involved in this sector in facing the problems of reducing waste and thinking of packaging as a resource to be reclaimed, recovered and recycled.”
Compliance
However, it predicts that achievement of the aluminium and plastics targets will be tight- with a potential gap of 7,000 tonnes of plastics recycling in 2011 and 22,000 tonnes in 2012 if the flow of plastics onto the UK market is high.
While the European packaging recycling targets have not been set beyond 2008, this analysis is based on targets set under the Packaging Regulations up until this year and on targets for 2011 and 2012 which are anticipated to be included as part of a Defra consultation later this month (see letsrecycle.com story and table below).
Outlining its recommendations to guarantee compliance, the report said: “Additional measures should be put in place to assure compliance in plastics (2011 and 2012) and in aluminium (2010 and 2011).”
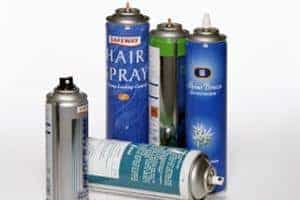
Recommended measures for aluminium include industry helping local authorities improve capture rates – with education and widening the types of material accepted from existing schemes from beyond just cans to include aerosols and foil. It says this is particularly important due to the potential carbon savings from collecting more aluminium.
For plastics, the report claims that bottles provide more potential in terms of recyclable tonnage (182-192,000 tonnes) than for instance mixed plastics collections (107,000 tonnes) – but says that those councils which can incorporate mixed plastics should be encourage to do so.
The study also recommends changing the existing PRN system to encourage additional collections of plastics, through setting sub-targets to enhance the value of specific types of plastic packaging, such as bottles or trays.
Away from home

For all materials, it stresses that the highest untapped recyclable quantities remain in the household waste stream – with the priority untapped materials by weight being glass and plastics. In 2007, this included 709-886,000 tonnes of glass, 417-430,000 tonnes of mixed plastics and 348-364,000 tonnes of plastic bottles.
Notably, the authors point out that there is more benefit in improving capture rates from existing household collection schemes than from extending kerbside coverage- with carbon benefits as well.
It claims that 100% capture rates from households which already have a kerbside service would improve collection levels by 63%, compared to 58% if all households received a kerbside service and continued to participate at current capture rates. This difference is exaggerated further in the case for aluminium, plastic bottles and steel.
The report says: “There is greater scope for increasing recycling rates through improving capture rates, then kerbside coverage.”
Transparency
The study also highlights how the financial contribution of the packaging industry towards packaging recycling is relatively unknown, with only 15% of the public aware of it, and suggests more is done to advertise the fact.
It recommends that reprocessors should publicly report how the money is spent and that an ongoing industry-wide ‘positive packaging' campaign should be delivered to inform the public of achievements and the benefits of packaging.
Impressive
Jane Bickerstaffe, from INCPEN, added: “INCPEN has been pleased to be involved with this important piece of work. It provides useful guidance for future planning by forecasting the quantity of products and packaging which is likely to be put on the market.”
Rick Hindley, executive director of the Aluminium materials organisation Alupro, commented: “This has been a huge piece of work, involving many stakeholders, evaluating many factors which will have an impact on increasing the volumes of packaging collected for recycling between now and 2012. It provides a unique insight into the opportunities for boosting collection levels for all materials.
“For the aluminium sector it has reconfirmed our view that we must focus on boosting collections of aluminium cans consumed away from home and boost the capture rates of drinks cans, aerosols and foil collected at kerbside.”
UK Packaging Business Targets
|
2010 |
2011* |
2012* |
|
| Aluminium |
40.0% |
41.0% |
42.0% |
| Glass |
81.0% |
83.0% |
85.0% |
| Paper |
69.5% |
70.5% |
71.5% |
| Plastic |
29.0% |
31.0% |
33.0% |
| Steel |
69.0% |
70.0% |
71.0% |
| Wood |
22.0% |
23.0% |
24.0% |
| Total Recovery |
74.0% |
76.0% |
78.0% |
| Minimum Recycling |
92.0% |
92.0% |
92.0% |
| Source: PackFlow 2012 |
* Targets expected beyond 2010. Official targets will be confirmed in consultation on changes to the packaging regulations, set to be issued later this month.


Register for free to comment