




2013 saw a number of reports on residual waste infrastructure capacity, with some warning that over-commitment to energy from waste (EFW) will constrain Englands ability to raise recycling rates.
Data on waste arisings and treatment capacity have their place in waste planning, but over-reliance on this type of high-level analysis is worrying.
Consider as an example a plot of Englands local authority recycling performance for 2011-12 against their ONS rural/urban classification, which ranges from Class 1 (major urban districts) to Class 6 (80% of the population in rural settlements). Among other things, we find that:
- Recycling rates above 60% are dominated by rural authorities (6.6% of total Class 6 versus 2.8% of total Class 1);
- Fifty percent of Class 6 local authorities achieved recycling rates of between 40-50%, while fifty percent in Class 1 managed 30-40%;
- The lowest recycling performance band (14-30%) is dominated by urban authorities (19% of total Class 1 against 2.2% of total Class 6).
From this perspective, it could be argued that notional EFW over-capacity is a red herring when it comes to improving recycling performance. Because urban recycling dominates Englands recycling performance, national recycling rates can only be raised appreciably by focusing on urban districts – developing better collection infrastructure, improving participation rates, and lowering recyclate contamination levels.
Treatment
Failure to do so while at the same time pushing even more waste out of landfill would effectively create more residual waste requiring the services of EFW plants. In other words, cause and effect are reversed – the constraint on recycling is at the front end of the management chain rather than at the disposal end.
This is not to say that the alternative analysis on offer is necessarily the right one. The point is that we need a more nuanced and probing analysis of arisings, capacity and other related information before making sweeping assertions regarding over or under-capacity and its effects on recycling.
This is all the more important given Defras tendency to take momentous infrastructure funding decisions on the basis of a relatively one-dimensional assessment of notional capacity gaps.
Local authority recycling rate v geographical location
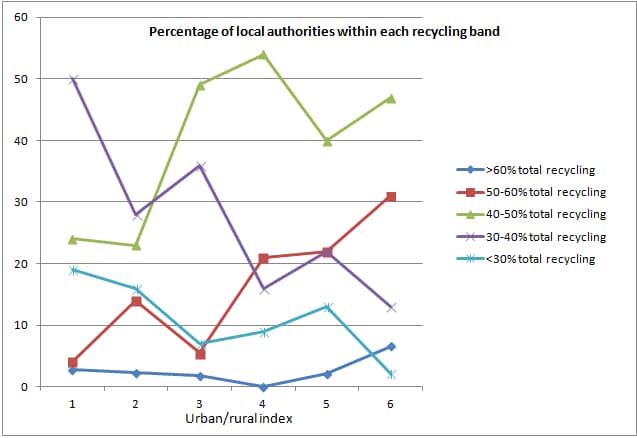
ONS rural/urban classification:
- Class 1 – Major Urban: districts with either 100,000 people or 50% of their population in urban areas with a population of more than 750,000
- Class 2 – Large Urban: districts with either 50,000 people or 50% of their population in one of 17 urban areas with a population between 250,000 and 750,000
- Class 3 – Other Urban: districts with fewer than 37,000 people or less than 26% of their population in rural settlements and larger market towns
- Class 4 – Significant Rural: districts with more than 37,000 people or more than 26% of their population in rural settlements and larger market towns
- Class 5 – Rural-50: districts with at least 50% but less than 80% of their population in rural settlements and larger market towns
- Class 6 – Rural-80: districts with at least 80% of their population in rural settlements and larger market towns

Register for free to comment