


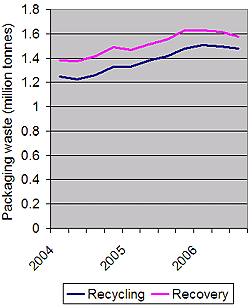
But, the data also shows that this year's recovery and recycling targets should be easy to meet – a situation that will not help with depressed packaging waste recovery note (PRN) prices.
Graph showing packaging recovery and recycling rates each quarter from Q1, 2003, to Q3, 2006 |
The data, for the third quarter of 2006, shows that overall recovery grew by just 1.6%, while overall recycling tonnages grew by 4.6% compared to the same quarter in 2005.
It reveals a 3.5% decrease in the amount of packaging glass being reprocessed domestically compared to July to August 2005. And, exports of glass, aluminium and steel have decreased compared to this time last year, down 11.7%, 26.2% and 15.9% respectively.
Significant growth has come in the domestic reprocessing of aluminium (up 12% on Q3 2005), steel (up 19%) and plastic (up 24%) packaging waste. On the exports side, growth was seen in paper (13.7% up) and plastic (up 7.6%) packaging waste streams only.
Database
Published on the National Packaging Waste Database, the figures come with the warning that 53 reprocessors or exporters did not get their data into the Environment Agencies on time. These reprocessors and exporters may now have their accreditation to issue PRNs suspended.
The data was published with updates on Q1 and Q2 figures for 2006, showing little or no overall growth in recovery and recycling, unlike the growth seen throughout 2005 (see graph above right).
The data for Q3, 2006, was as follows (n.b. growth columns refer to change compared to Q3, 2005):
| Domestic reprocessing (t) |
Growth (%) |
Exports (t) |
Growth (%) |
Total (t) |
Growth (%) |
|
| Paper | 380,250 | 1.0 | 347,023 | 13.7 | 727,273 | 6.7 |
| Glass | 252,119 | -3.5 | 57,151 | -11.7 | 309,270 | -5.1 |
| Aluminium | 8,899 | 12.1 | 2,145 | -26.2 | 11,044 | 1.8 |
| Steel | 46,870 | 18.9 | 46,183 | -15.9 | 93,053 | -1.4 |
| Plastic | 52,890 | 24.4 | 71,613 | 7.6 | 124,503 | 14.1 |
| Wood | 214,229 | 11.9 | 0 | 0 | 214,229 | 11.8 |
| Total Recycling | 955,257 | 3.9 | 524,115 | 6.0 | 1,479,372 | 4.6 |
| Recovery | 98,764 | -29.2 | 0 | 0 | 98,764 | -29.2 |
| Total Recovery | 1,054,021 | -0.4 | 524,115 | 6.0 | 1,578,136 | 1.6 |
Source: letsrecycle.com analysis of Defra figures
Targets
Despite the apparent slow-down in recovery and recycling rates – which could have come as the result of a variety of factors including low PRN prices, mill closures and the difficulty of collecting material from households – the recovery and recycling targets set for 2006 now look very easy to reach.
While the average packaging recovery tonnage for each quarter this year has been about 1.6 million tonnes, only one million tonnes of recovery will be needed to reach this year's targets. Among the materials, only glass needs to continue reprocessing at similar rates to hit material-specific targets.
| Related links: |
Paper, aluminium, steel and plastic only have to achieve a fraction of the reprocessing/export levels to hit their targets, while the wood stream appears to have met its target already (see table below).
This situation depends on the findings of Defra's investigation of the data concerning the amount of packaging put on the market by obligated packaging producers (see letsrecycle.com story).
Table: Showing the situation for 2006, based on the latest data available from Defra
| Q1 | Q2 | Q3 |
Needed in Q4 (t) |
Target 2006 (%) |
Obl. pack. (t) |
Target in 2006 (t) | |
| Paper | 705,238 | 711,689 | 727,273 | 99,176 | 66.5 | 3,373,498 | 2,243,376 |
| Glass | 355,638 | 333,136 | 309,270 | 301,143 | 65 | 1,998,750 | 1,299,187 |
| Aluminium | 11,770 | 11,705 | 11,044 | 4,218 | 29 | 133,577 | 38,737 |
| Steel | 109,046 | 103,899 | 93,053 | 687 | 56 | 547,653 | 306,685 |
| Plastic | 118,708 | 124,830 | 124,503 | 53,756 | 23 | 1,833,900 | 421,797 |
| Wood | 206,309 | 212,045 | 214,229 | -447,269 | 19.5 | 950,326 | 185,313 |
| Total Recycling | 1,506,709 | 1,497,304 | 1,479,372 | 894,688 | (min. 92% of recovery) | 5,378,073 | |
| Recovery | 121,281 | 118949 | 98,764 | -338,994 | |||
| Total Recovery | 1,627,990 | 1,616,253 | 1,578,136 | 1,023,352 | 66 | 8,857,169 | 5,845,731 |
Source: letsrecycle.com analysis of Defra figures


Register for free to comment